1.
Generate simple table in R that consists of four rows: Country, age, salary and purchased.
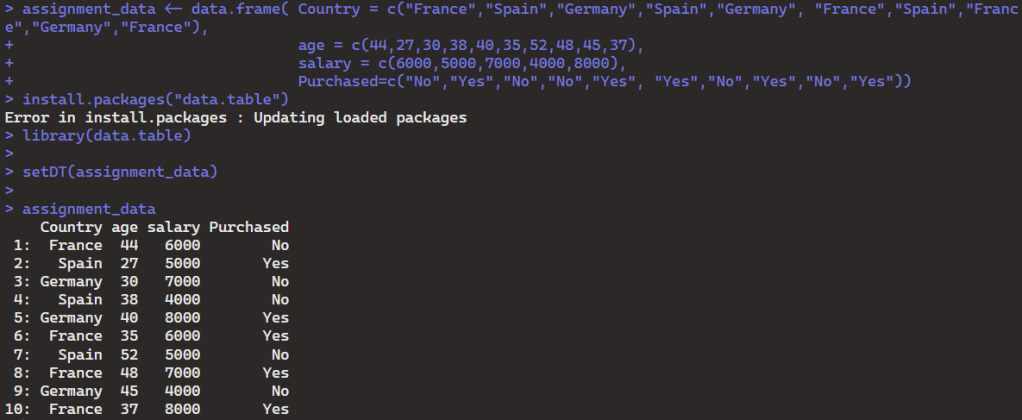
Here I took the data frame and turned it into a simple table using setDT() function.
2. Generate contingency table also know as rx C table using mtcars dataset.

The contingency table shows how many times (frequency) there are 3 gears with 4,6, and 8 cylinders in the mtcars data set. As well as the frequencies of cylinders for 4 and 5 gears.
2.1 Add the addmargins() function to report on the sum totals of the rows and columns of assignment9 table
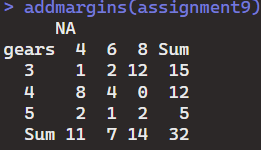
The sum of frequencies of cylinders when there are 3 gears is 15. The sum of frequencies of cylinders when there are 4 gears is 12. And the sum of frequencies of cylinders when there are 5 gears is 5.
2.2 Add prop.tables() function, and report on the proportional weight of each value in a assignment9 table
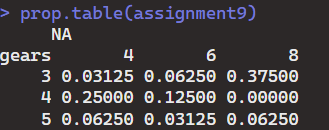
This table shows that the highest proportion of frequency is 3 gears with 8 cylinders and the lowest proportion is 4 gears with 8 cylinders because there are none reported in the mtcars data frame.
2.3 Add margin = 1 to the argument under prop.table() function, and report on the row proportions found in assignment9 table.
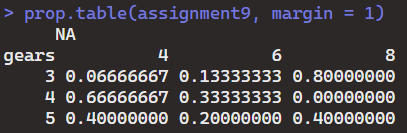
When looking at the row proportions, among the 3 gears, 8 cylinders has the highest proportion in the mtcars data set, and 6 gears has the lowest. In the row of 4 gears, the 4 cylinder has the highest proportion and the 8 cylinder has the lowest. And lastly, among all the 5 gears in the mtcars dataset, 4 and 8 cylinders are tied in proportion, and 6 cylinders is the lowest.

Leave a comment