The table below represents charges for a student credit card.
a. Construct a time series plot using R.
b. Employ Exponential Smoothing Model as outline in Avril VoghlanLinks to an external site.‘s notes and report the statistical outcome
c. Provide a discussion on time series and Exponential Smoothing Model result you led to.
| Month | 2012 | 2013 |
| Jan | 31.9 | 39.4 |
| Feb | 27 | 36.2 |
| March | 31.3 | 40.5 |
| Apr | 31 | 44.6 |
| May | 39.4 | 46.8 |
| Jun | 40.7 | 44.7 |
| Jul | 42.3 | 52.2 |
| Aug | 49.5 | 54 |
| Sep | 45 | 48.8 |
| Oct | 50 | 55.8 |
| Nov | 50.9 | 58.7 |
| Dec | 58.5 | 63.4 |
a)
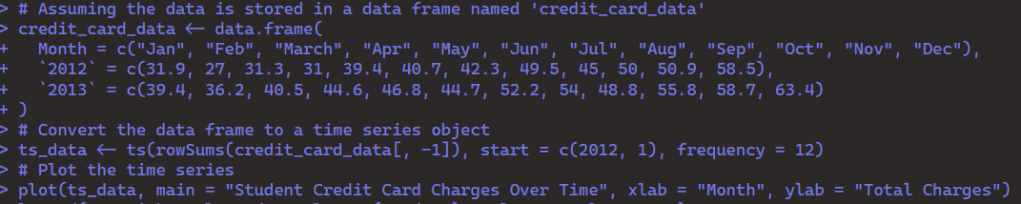
In this first step, once I created the data frame I had to convert it into a time series object so I could properly plot it as so.
b)

Once the fitted model was created I printed a summary so I could make sure that the proportions and parameters were valid.

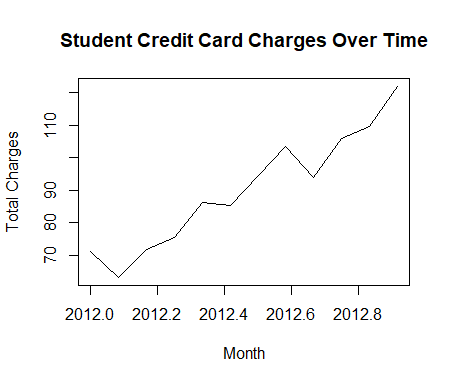
I created the same time series plot as before, but made the line blue this time so that the fitted line I will add can stand out.

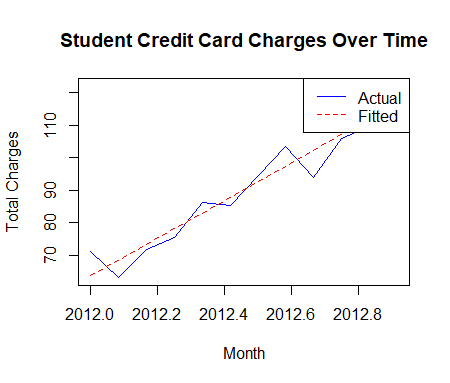
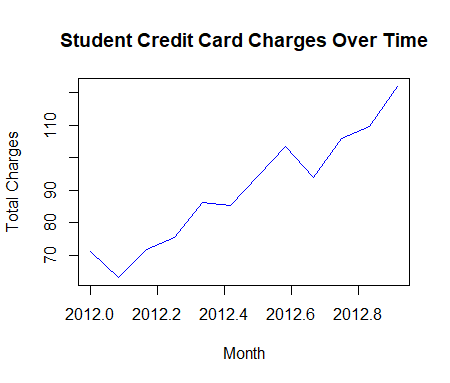
As you can see, the fitted line is represented by a red dashed line. I include a legend in the plot so the viewer may easily tell the difference as well.
c) The time series plot provides a visual representation of how student credit card charges have changed over time. From the fitted plot, we can observe that the fitted line shows an exponential progression. Therefore, we can assume for future reference, that a student’s credit card charges will gradually increases as the months go by through each year.

Leave a comment