In this assignment we were given hospital data and asked to compare the information via boxplot and histogram.
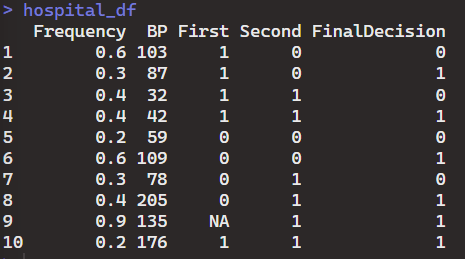
First I created a data frame in order to view all the data easily.
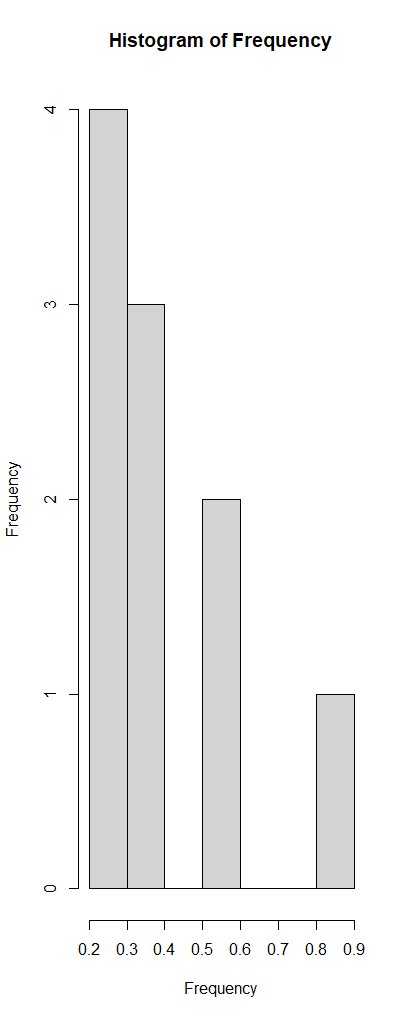
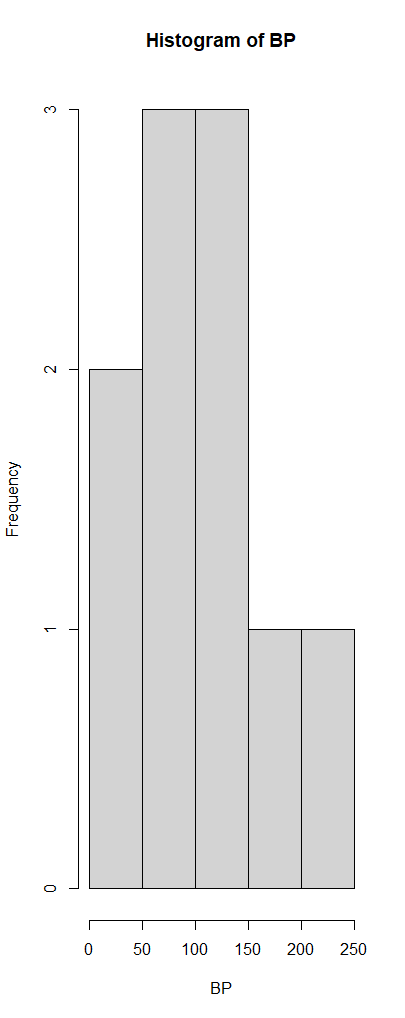
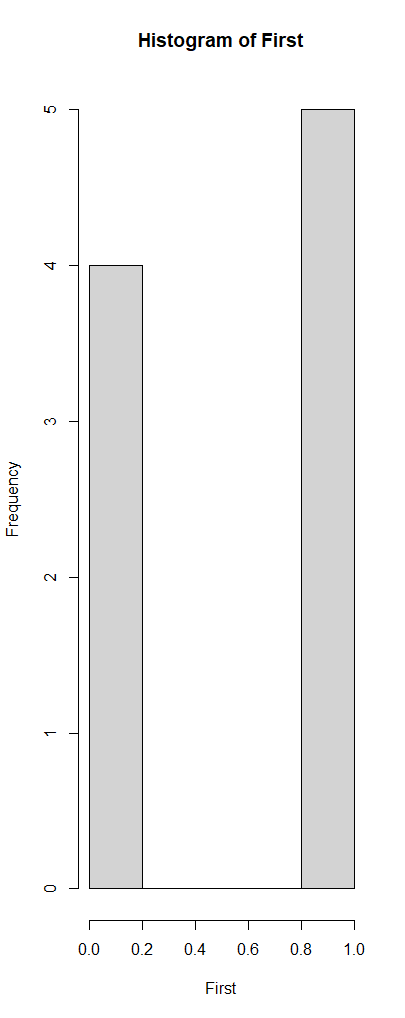
Histograms:


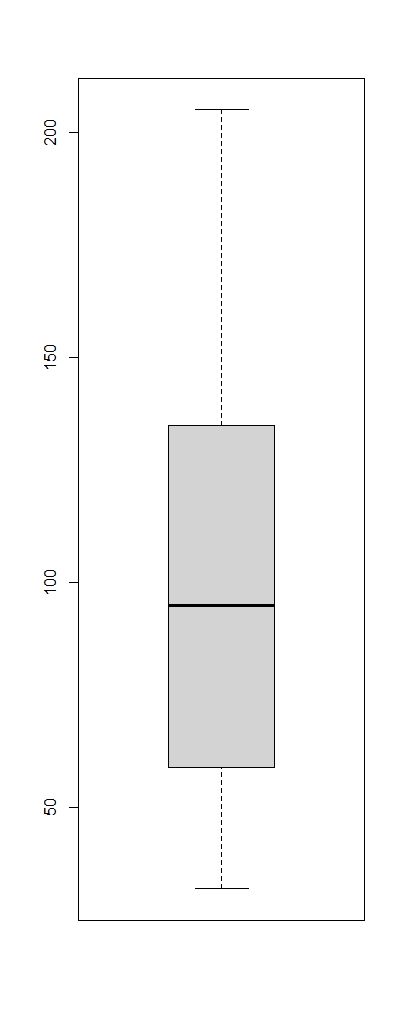
Boxplots:
FREQUENCY

BP
FIRST
SECOND

FINALDECISION

When looking at the BP and MD final decisions, it seems that in the end the MDs considered initial BP readings of 87, 42, 109, 205, 135, and 176 to be “High”.
GitHub Repository:

Leave a comment