For this assignment we were asked to create a visual Social Network analysis. I decided to use Rstudio for this task. Specifically, the “igraph” package.
- Create a sample social network data:
- I defined a set of nodes (individuals in the network) and edges (connections between individuals). Each node represents a person, and each edge represents a relationship between two individuals. In this example, I made a simple dataset with seven nodes (“Alice”, “Bob”, “Charlie”, “David”, “Eve”, “Frank”, “Grace”) and edges indicating who knows whom.

2. Create the graph object:
- Next, I used the graph_from_data_frame function from the igraph package to create a graph object from the sample data. This function takes the edge list and the list of vertices (nodes) as input and constructs a graph. By specifying directed = TRUE, I indicated that the relationships between individuals are directed (i.e., they have a direction, such as “Alice knows Bob” but not necessarily “Bob knows Alice”).

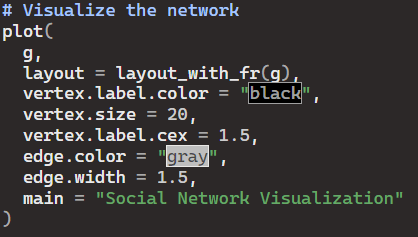
3. Visualize the network:
- I used the plot function to visualize the network graph. I specified various parameters to customize the appearance of the plot:
- layout: The layout algorithm determines the arrangement of nodes in the plot. Here, I used the Fruchterman-Reingold layout (layout_with_fr) which is a force-directed layout algorithm that tends to place nodes that are connected closer together.
- vertex.label.color: Specifies the color of the node
- labels.vertex.size: Determines the size of the nodes in the plot.
- vertex.label.cex: Specifies the size of the node labels.
- edge.color: Specifies the color of the edges (connections between nodes).
- edge.width: Determines the width of the edges in the plot.
- main: Adds a main title to the plot.
By following these steps, I was able to create a clear and concise visual representation of a social network using the “igraph” package in R.


Leave a comment