Project Objectives and Accomplishments
1. Problem Description:
- Objective: To explore the relationship between various factors and the occurrence of diabetes.
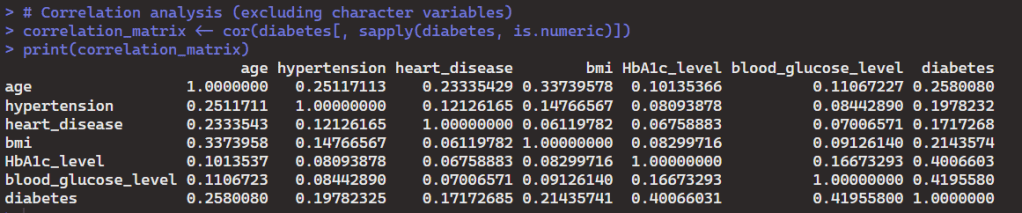
- Hypothesis: There exists a correlation between age, hypertension, heart disease, BMI, HbA1c level, blood glucose level, and the likelihood of having diabetes.
2. Related Work:
- The problem of understanding diabetes and its related factors is crucial in public health research.
- Visual analytics tools like RStudio and ggplot2 have been used to analyze health-related datasets.
- Existing visual analytics tools demonstrate interactive dashboards analyzing diabetes prevalence across different demographics, providing insights into risk factors or potential interventions.
3. Solution:
- Methodology: Utilizing multivariate analysis techniques to examine correlations between variables and diabetes occurrence.
- Technical Approach: Employing RStudio and ggplot2 for data preprocessing, exploratory data analysis, and visualization.
Steps:
Step 1: Data Preparation:
- Import the “diabetes” dataset into RStudio.
- Inspect the data
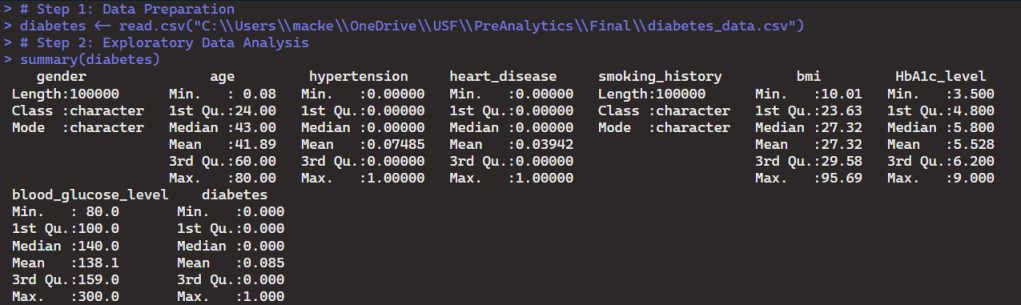
Step 2: Exploratory Data Analysis (EDA):
- Explore relationships between variables using correlation analysis.
- Visualize the data using more visually complex plots with appropriate aesthetics and themes.
Step 3: Visualization and Discussion:
- Utilize RStudio and ggplot2 to create visually pleasing and affective plots with enhanced aesthetics.
- Perform additional visualization techniques, including part-to-whole analysis for character variables (gender and smoking history) and deviation analysis.

Visualizations in RStudio:
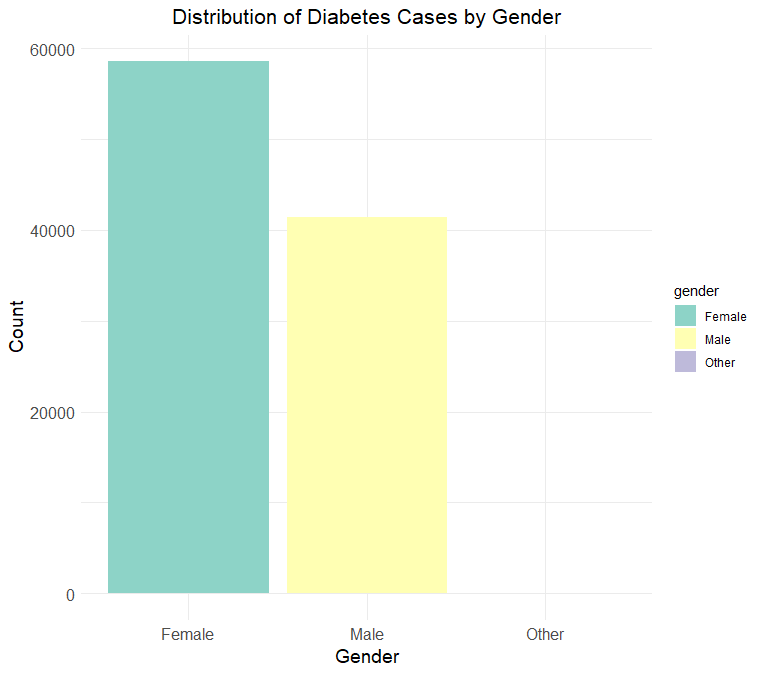
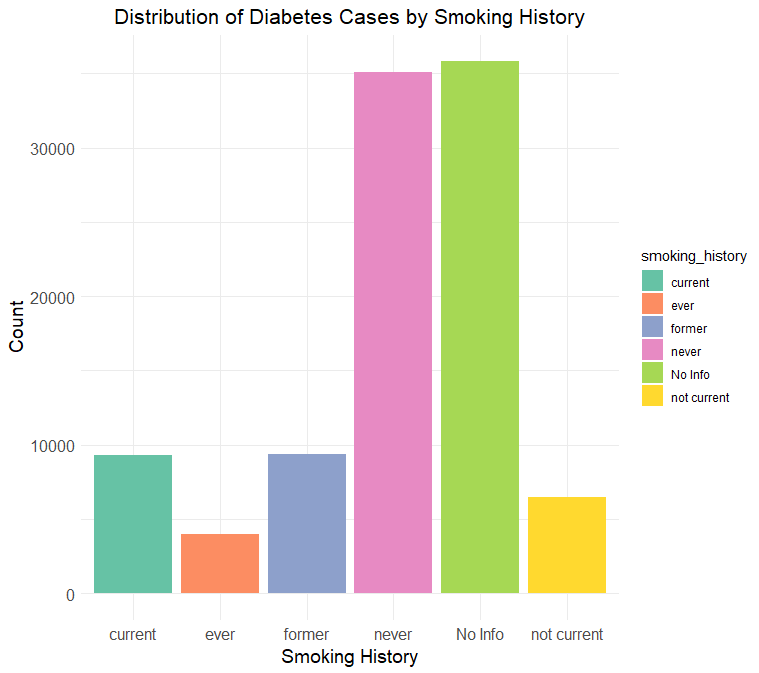
- Part-to-Whole Analysis:
- Created bar charts to illustrate the distribution of diabetes cases by gender and smoking history.
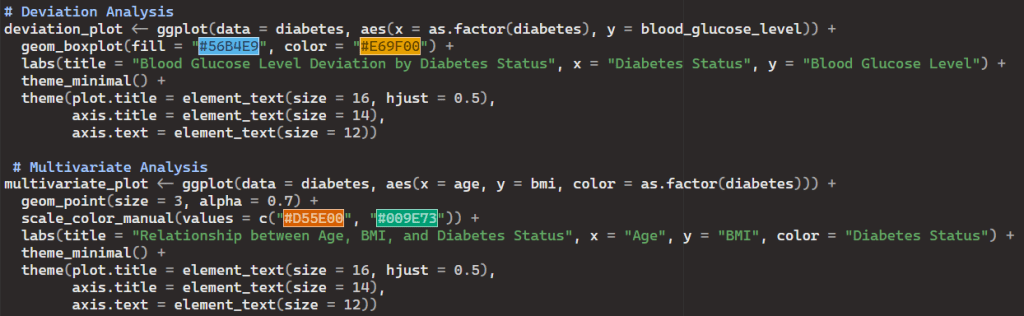
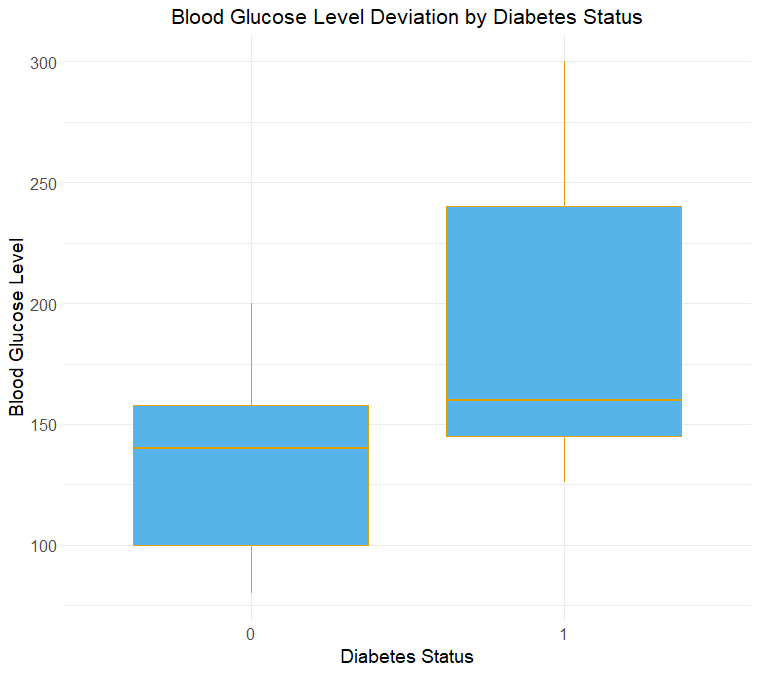
2. Deviation Analysis:
- Created a box plot comparing the distribution of blood glucose levels between diabetic and non-diabetic groups.
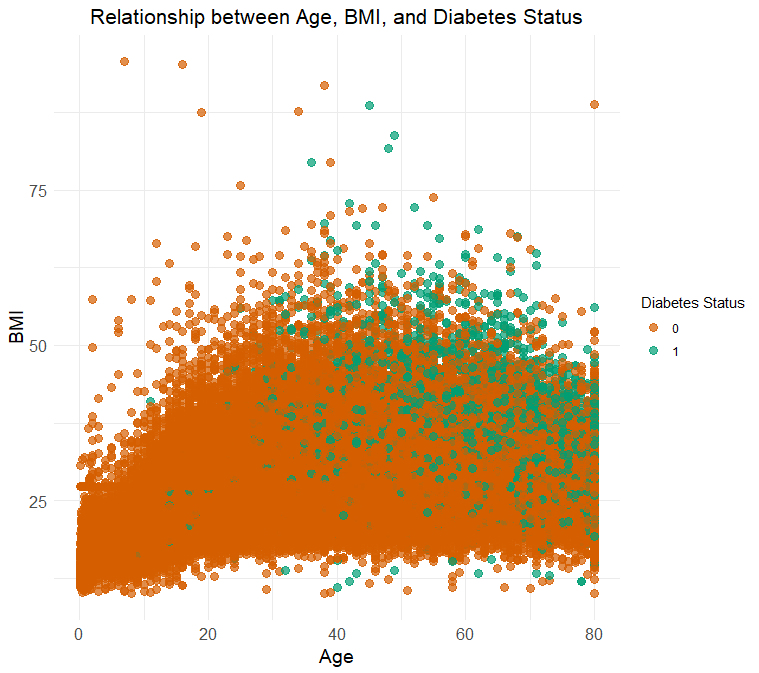
3. Multivariate Analysis:
- Created a scatter plot visualizing relationships between age, BMI, and diabetes status, with diabetes status represented by color.
Conclusion:
Through the visualizations I created, I can draw many conclusions about the variables presented and how they relate to a patient’s diabetic status. In the multivariate analysis you can see that more cases of diabetes are prevalent in patients with higher BMI and Age numbers. The boxplot shows a slight deviation in glucose means in patients with and without diabetes, although the maximum is much higher in cases where the patients are diabetic. There also seemed to be a slight variation in diabetic cases based on gender, but what I found to be the most interesting result of these visuals is the major variance in diabetics based on their smoking status.
This project is a great example of how creating visuals provides the advantage of being able to create a sort of “filter” on the data so the output includes the exact variables you are aiming to focus on and compare. It can be difficult to interpret such medical statistics in a simple table, but clerical and efficient visuals such as the ones above make the interpretation process much easier.

Leave a comment