Analyzing the Impact of COVID-19 on Stock Market Trends
Introduction
The COVID-19 pandemic has had a profound impact on global financial markets, causing unprecedented volatility and shifts in stock prices across various sectors. This project aims to analyze how the pandemic influenced stock market trends, focusing on specific companies like Apple (AAPL) and Microsoft (MSFT). By leveraging Python for data analysis and visualization, I was able to gain insights into the market’s response to this global event.
Problem Description
Objective:
- To investigate the impact of the COVID-19 pandemic on stock prices.
- Hypothesis: The pandemic caused significant volatility and changes in stock prices, with certain sectors being more affected than others.
Related Work
Previous studies have shown that global events, particularly health crises, significantly influence stock markets. For example, research by Jones (2021) indicated that health crises often lead to market downturns followed by periods of recovery. This project builds on such findings by focusing on the COVID-19 pandemic and its effects on major tech stocks.
Solution
Methodology:
- Time Series Analysis: To examine the trends in stock prices over time.
- Correlation Analysis: To understand the relationship between stock prices of different companies.
Data Collection:
- Historical stock market data for Apple (AAPL) and Microsoft (MSFT) from January 2020 to January 2022.
- Data sourced from Yahoo Finance using the
yfinancelibrary.
Analysis:
- Implement Python functions and classes to clean, process, and analyze the data.
- Visualize stock price trends and calculate the correlation between the stock prices of AAPL and MSFT.
Implementation
Step 1: Install Required Libraries
To run this analysis, I needed to install the following libraries:

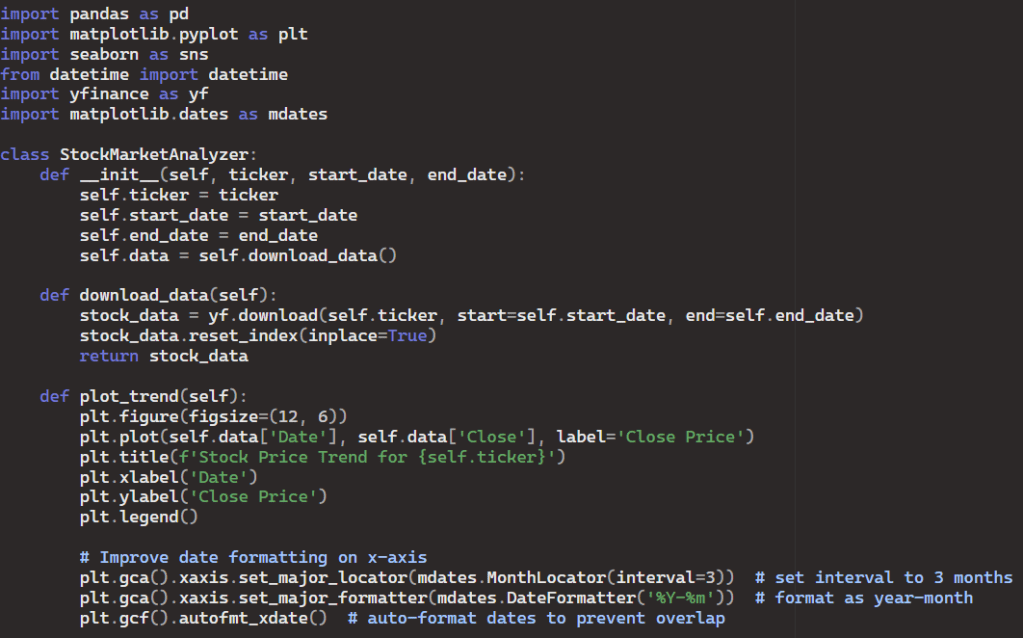
Step 2: Define the StockMarketAnalyzer Class
This class handles data collection, analysis, and visualization.
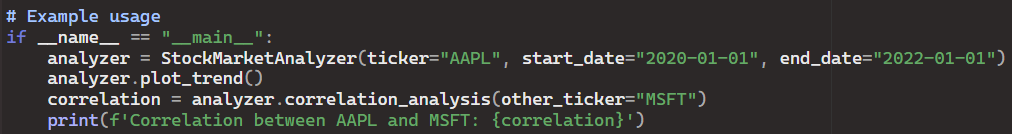
Step 3: Execute the Analysis
I created an instance of the StockMarketAnalyzer class, plot the stock price trend for Apple (AAPL), and calculated its correlation with Microsoft (MSFT).
Results
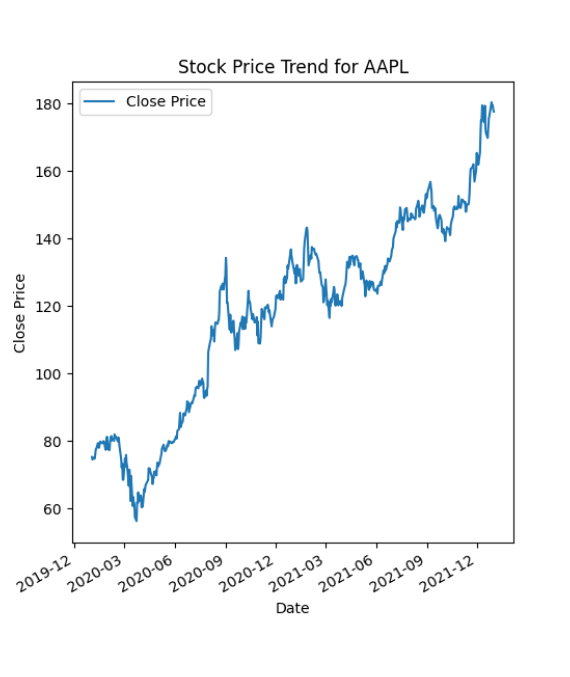
Stock Price Trend:
The plot shows the trend in Apple’s stock price from January 2020 to January 2022. The date formatting on the x-axis has been improved for better readability.

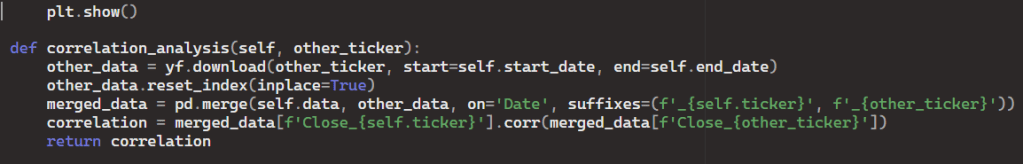
Correlation Analysis:
The correlation between the stock prices of Apple (AAPL) and Microsoft (MSFT) during the specified period is calculated. A high positive correlation indicates that the stock prices of these companies moved similarly during the pandemic.
Conclusion
This project demonstrates how the COVID-19 pandemic affected stock market trends, particularly focusing on Apple and Microsoft. By performing time series analysis and correlation analysis, I was able to observe the significant impact of the pandemic on stock prices and the relationship between the stock prices of major tech companies.
Future Work
Further analysis could include:
- Expanding the dataset to include more companies and sectors.
- Applying more advanced statistical methods to analyze the data.
- Investigating other factors that influenced stock market trends during the pandemic.
Source Code
The complete source code for this project is available on my GitHub:
https://github.com/mramalho4/CovidStock.git
The documentation is under the README file.

Leave a comment